Hit ‘Em Where It Sticks: Big-Picture Executive Thinking for CS Leaders
Concrete examples of how to bring bigger-picture thinking to the table, align sticky drivers with cash-driving strategies, and succeed in the C-Suite.

The very first edition of Tactic Talk – “So You Made it to the SaaS C-Suite: Here’s How to Keep the Job” – discussed two of the most common reasons SaaS executives don’t last: 1) failing to tie their work back to their companies’ top and bottom lines (getting stuck working in the business versus on the business) and 2) erroneously prioritizing the needs of their functional swimlanes over those of their “First Team” (the most senior team they sit on).
I’m excited to offer a deep dive into #1–the importance of working on the business–and use the customer success function as a case study. There are myriad ways to tie the functional work of a customer success team to the company’s P&L. In recent Tactic Talk installments we’ve talked about actionable tips for growing existing customer ACVs and boosting margins, but the most obvious way to align the CS organization to cash-driving outcomes is to understand your company’s “sticky drivers:” what products and behaviors yield higher net retention rates? Once those drivers are understood, companies can adjust their KPIs to focus on the metrics that really matter (sorry, net promoter score…) and use those drivers as a rallying cry for the organization at large.
First and foremost, you must unpack what attributes actually drive logo retention and contract expansion
I have suboptimal news for those of you who slept through your high school statistics class: regression analysis is actually quite useful in the real world. The most straightforward way to understand your company’s sticky drivers is to run a statistical analysis of which customer attributes drive stronger net dollar retention rates.
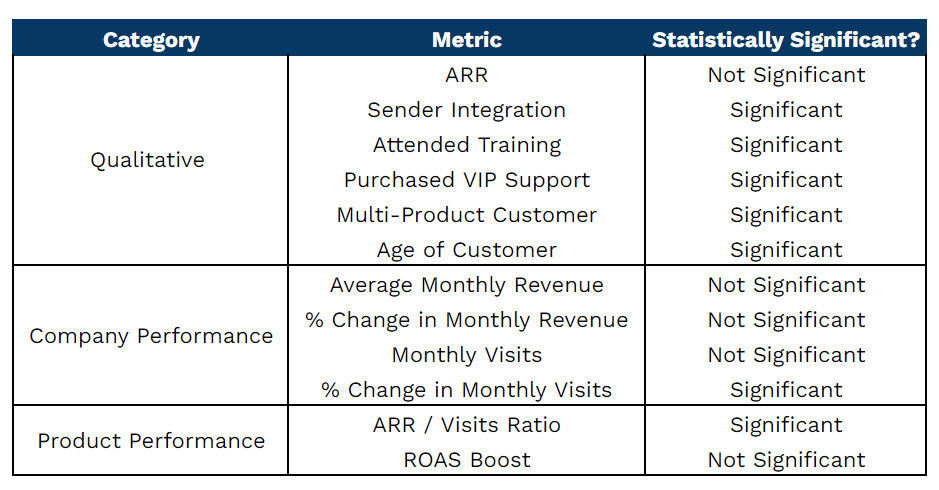
The metrics in the example summary below are not exhaustive, but offer a sense of the types of attributes to consider. For Company X, a client’s ARR was not a significant predictor of net retention, but many other qualitative factors were: leveraging integrations, attending training sessions, using multiple products, etc. More importantly though, the analysis considered customer and product performance metrics in addition to just binary qualitative traits, which proved very revealing. The % change in the client’s monthly site visits is an intuitive customer health metric: when the customer’s volume declines, so does their net retention rate. The % change in monthly ARR/visits is a proxy for customer value: the lower the multiple, the stickier the customer.
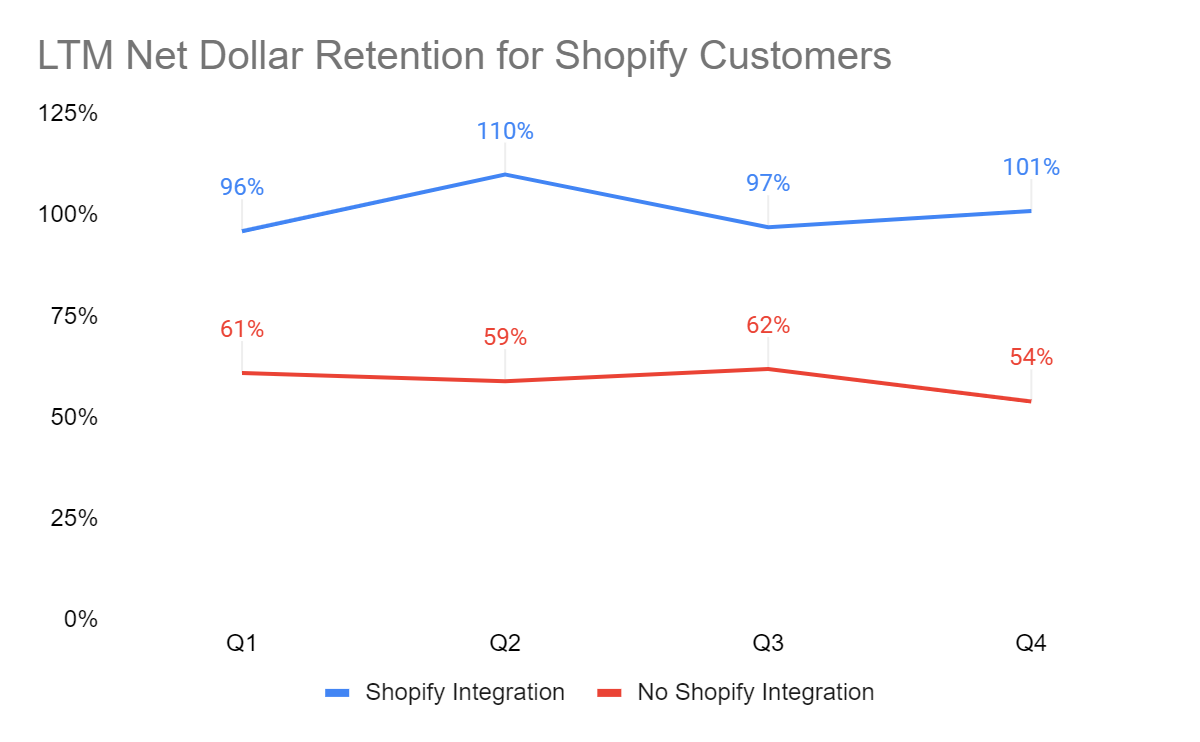
Once you understand which attributes are the leading indicators of net dollar retention, you can also dive deeper into the magnitude of each impact. If an ecommerce enablement business determines a Shopify integration is indicative of a stickier customer, they should understand the net retention delta between a customer using the integration versus not.
In this example, trailing twelve month net retention is nearly double for customers using the Shopify integration, so it would be prudent to get more customers using it!
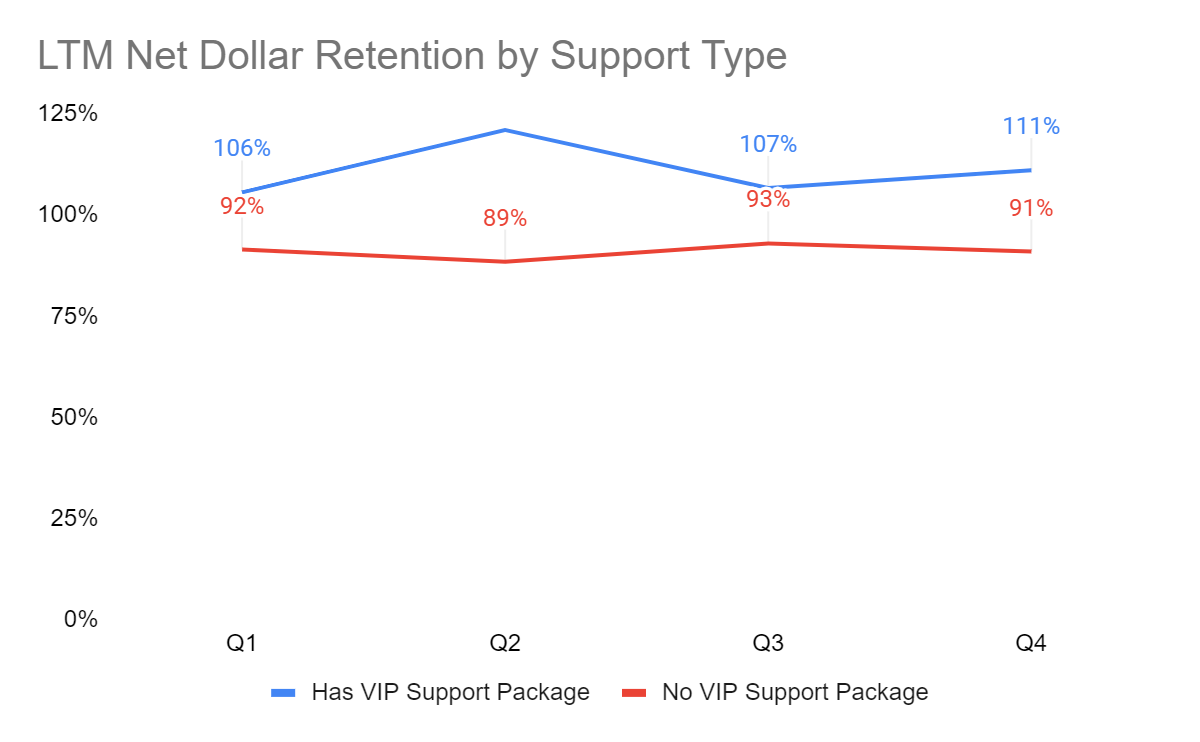
The next chart considers trailing twelve month retention rates based on support packages and suggests that customers who purchase a VIP white glove offering are stickier. This is a surface-level snapshot of the data for the sake of simplicity, but in practice SaaS companies can slice and dice the data even further, e.g. by contract value. In my prior life as an operator, we uncovered such a striking delta in the net retention rates for large customers with VIP support that we mandated that any customer over $300K ARR was required to upgrade to that level.
Price/value metrics are often leading indicators of churn, so make sure you have one in place
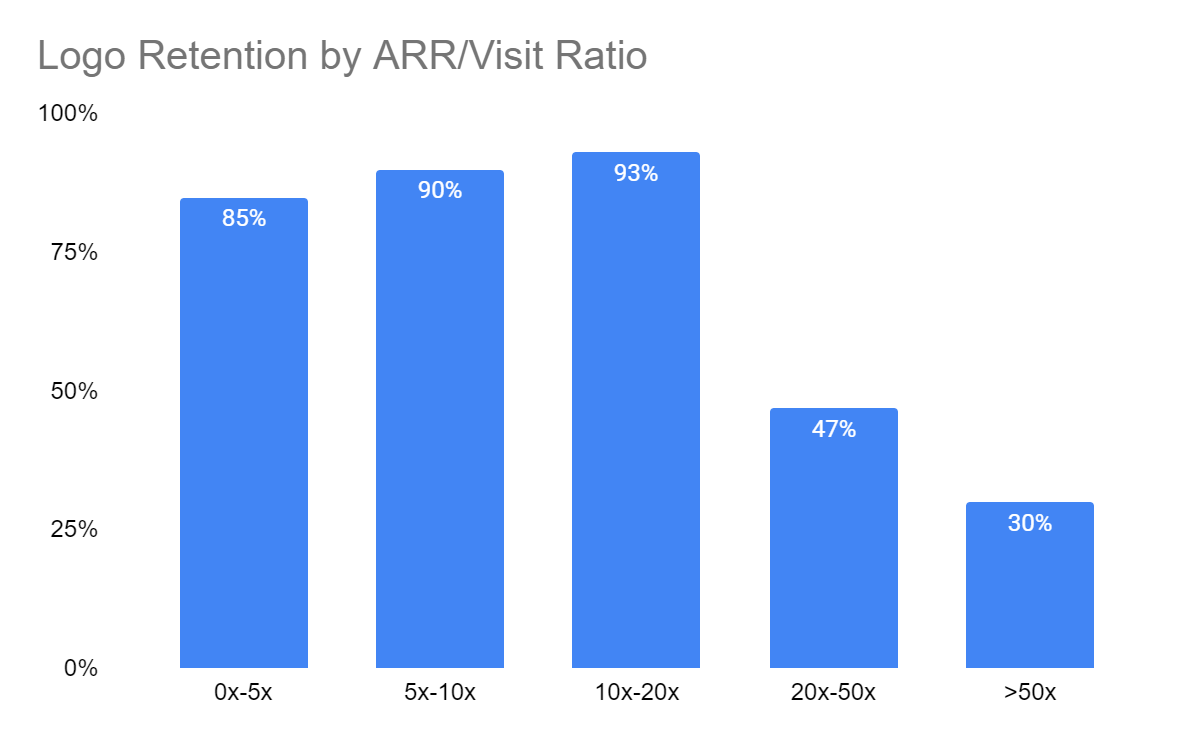
When brainstorming your list of potential sticky drivers, be sure to include a price/value metric in your analysis, as that metric is very often a leading indicator of churn risk.
In the example below, SaaS Company X—let’s still assume an ecommerce enablement business—is using an ARR/visits ratio (client’s visit volume on their own website) as its price/value ratio. When that ratio crosses 20x, customers will outright churn more than half of the time! Armed with this insight, the contract approval team or deal desk can put measures in place to ensure Company X is not signing new contracts with a ratio above 20x!
When I was the CRO at Sailthru, the ROI metric for our core product was revenue per email sent through our platform, which we then juxtaposed against the implied cost to the customer of each email they sent. If you get stuck thinking through a value metric for your business, you should consider brainstorming with your finance team! (We’ll also offer a tip for how to collect ROI information later in this post.)
Optimize your new customer implementations for attributes you can control
Once you have a command for your sticky drivers, you should optimize new customer implementations to control for them. More often than not, the time to value (TTV) metric for a new implementation is focused on a customer simply going live (the “lift and shift,” if you will), but a better approach is to measure it as the time required to achieve the most meaningful sticky driver behavior.
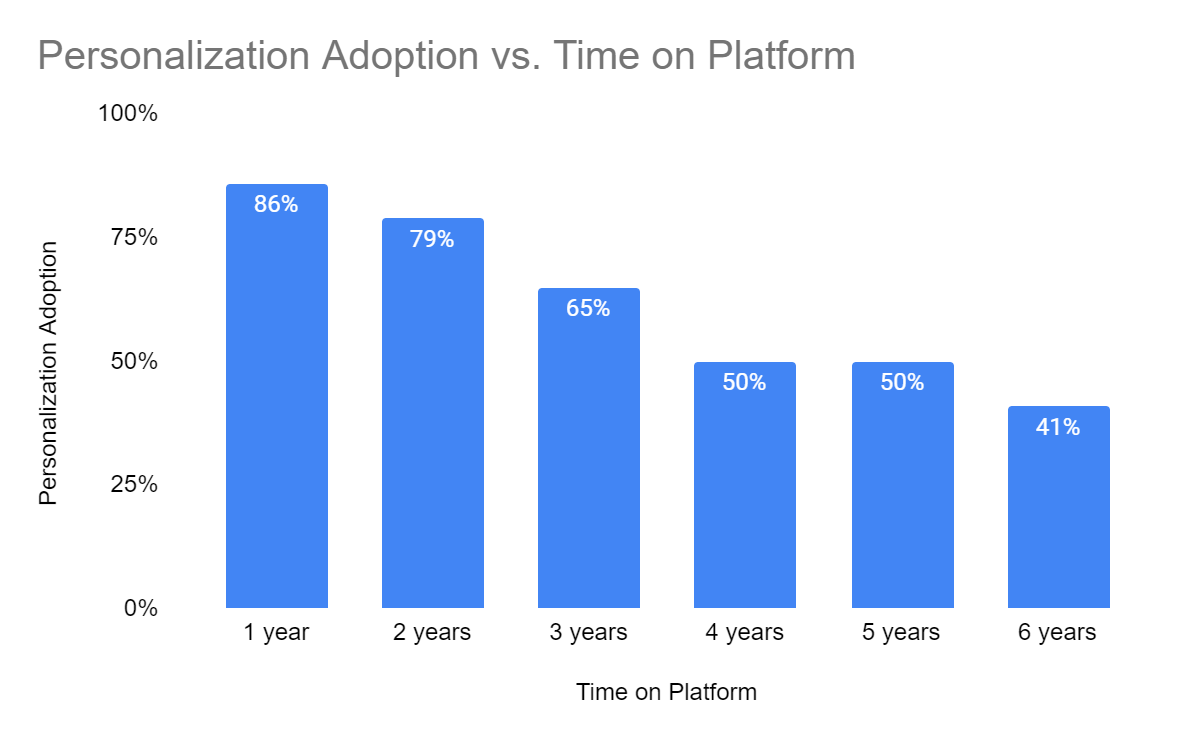
At Sailthru we identified adoption of our personalization technology as the stickiest driver of them all: if customers were using Sailthru’s algorithms to power their marketing content, they were happier and stickier.

Once we identified this striking difference, we changed our TTV calculation to when customers sent their first communications using our personalization technology, and we didn’t consider an implementation complete until that happened. Yes, the metric looked much worse, but we were okay with that given this behavior had positive long-term benefits. The data below is illustrative only (as is most everything here), but the trend is accurate: we ultimately saw the fruits of our labor in getting newer customers using the technology.
An important note for enterprise SaaS companies with longer implementation periods: it is important that your initial contract length is long enough to give you ample time to prove your value. If your TTV for the stickiest driver is seven months and you’re signing 12-month contracts, a renewal conversation will probably start ~60 days after that initial value realization, which is suboptimal. Longer implementation periods suggest a need for longer initial contracts. If you cannot secure a multi-year deal with a brand new customer, try for 15 or 18 months. (Editor’s note: obviously long implementation periods also imply a ripe opportunity for improving the overall implementation process with product enhancements!)
But never fear, you’re not SOL if you miss an opportunity to push your sticky drivers during the initial implementation. Consider using tools such as structured customer health checks to periodically reevaluate the customer’s implementation and make recommendations for how their setup could be improved. In my Sailthru example, we actually offered free professional service hours to customers not using personalization (to give them the plumbing to use it) because we knew those customers would be that much more valuable on the other side.
Implementations aside, consider where else you might offer free services in the name of the long game. At Sailthru our data showed that customers who attended a live full-day training were significantly more likely to renew, so we made a regular habit of paying for at-risk customers to fly to training sessions if needed.
Consider asking customers for additional input data
Thus far the analysis inputs discussed have been data points Company X had on hand or could calculate in a straightforward manner, but there is also merit in asking customers for additional inputs.
While at Sailthru, we issued a slightly longer-form NPS survey (~five minutes total to complete) each quarter. In each of those surveys, we provided a list of new features we shipped in the 90 days prior and asked customers to indicate whether they 1) knew about the release and 2) if it had any benefit to their business.

The sample data above is directionally in line with what we learned: there was a very material change in both NPS and net retention for customers who simply knew about product changes. The differences between whether or not the product changes had a “real” benefit or “little to no” benefit were much smaller. Perception was reality!
With this data in hand, we made a big push on product marketing, and really leaned into the adage that people must hear the same message seven times before they process it. Incidentally, because we were an email service and we emailed out our release notes through our own platform, we were able to track that ~50% of the people who said they didn’t know about certain product release notes had actually opened the email about that very change they claimed to know nothing about! Put another way, one simple email was not sufficient. We launched monthly “Shipped by Sailthru” email digests, put notifications in the product, hosted live webinars, and so on.
I already emphasized the importance of a price/value metric. If you truly cannot think about how to tackle that, ask the customer! In that same longer-format NPS survey, we also asked customers to rate us 1-5 on a few different metrics that we knew were important to them, and then segmented our NPS scores based on their scores. Customers who awarded us scores of 4-5 had significantly higher NPS scores, so we used this insight to launch a weekly automated metrics report to proactively communicate our value. Sure, customers would sometimes argue attribution or some calculation nuance, but simply putting these numbers in front of them proved very powerful.
Focus your board reporting on the metrics that really matter
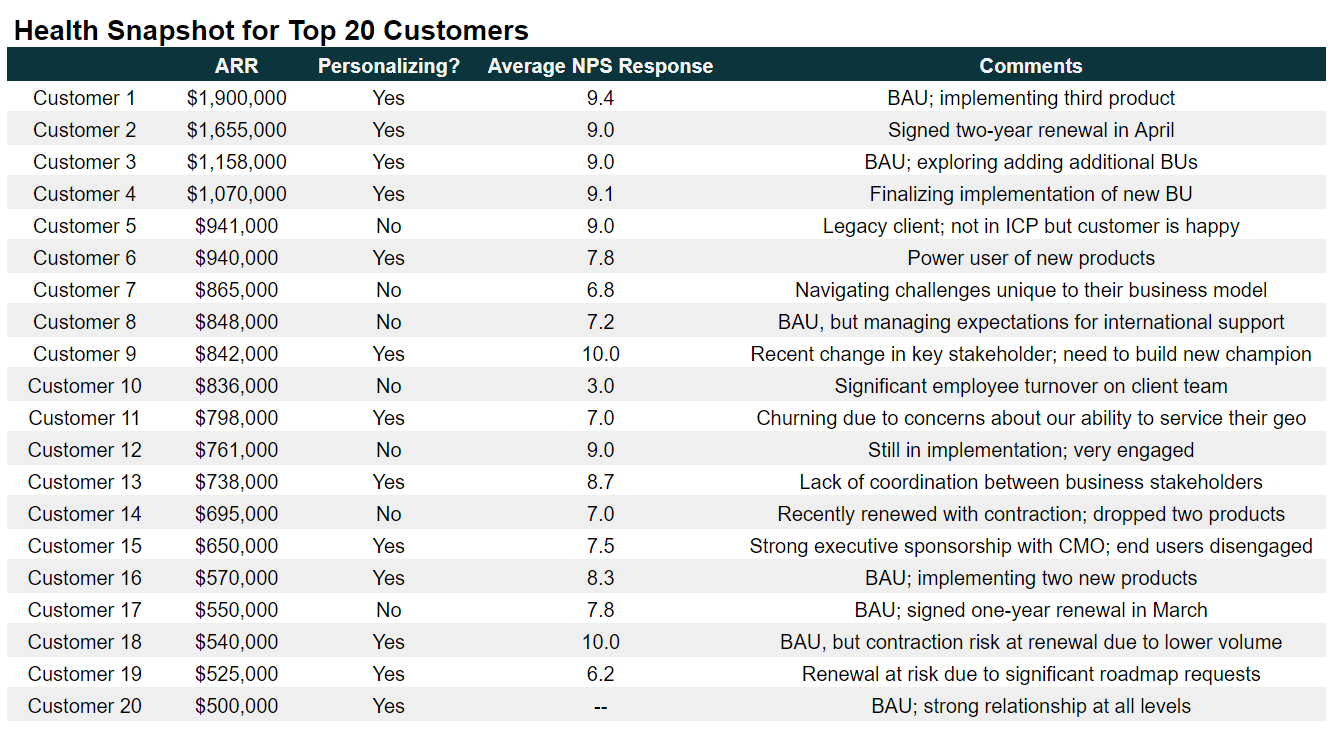
Once you’ve aggregated all of your customer insights, make sure your board metrics are focused on the metrics that really matter. To harp on the Sailthru personalization example, it felt much more relevant to educate board members on which of our top 20 customers were not using the personalization technology than to try to opine on a red/yellow/green sentiment status for them.
In a business where multi-product adoption is a key sticky driver, I would expect to see board reporting that highlights improvements in product adoption per customer.
…and sticky drivers aside, thinking “on” the business means you are also thinking about cold hard cash. Renewal managers can be ninjas for a company’s working capital situation. If you’re making progress converting more customers to paying upfront, celebrate as much!
—
While this case study for working on the business is focused on customer success, make no mistake: every business function falls victim to the swim lane trap of thinking too narrowly at some point in its evolution. To thrive in their seats, executives must understand precisely how their functional work and initiatives drive revenue-impacting outcomes for their companies.
