Mind the Pipeline: Using Cohort Analysis to Forecast Bookings and Identify Gaps
Primary Impact shares a customer success guide on cohort analysis, implemented by Cassie Young with B2B portfolio companies like Black Crow, Dandy, and Virtual Facility.


In Primary Impact’s Hindsights 20/20 series, we review the strategies we’ve deployed over the last few years and share what works. Follow along as I reintroduce valuable learnings that have stood the test of time and can inform current practices. Keep up with new installments by following me on LinkedIn.
Consumer businesses regularly turn to cohort analysis frameworks for both assessing and forecasting customer retention, yet somehow the practice is far less discussed in the B2B world. Understanding pipeline cohort behavior is not only mission-critical for forecasting bookings, but also for understanding pipeline gap analysis. Follow along as I share strategies I’ve practiced while working with B2B companies like Black Crow, Dandy, and Virtual Facility.
A refresher on cohort analysis
Before we dive into the nuts and bolts of pipeline cohort analysis, it’s important to understand the fundamental nature of cohort analysis: It is a method for examining how a population behaves over time, ultimately so that you can make an apples-to-apples comparison of behaviors at certain points along the way.
A very pragmatic way to understand cohort analysis is to think about a drug trial. If Person A started a drug trial for Condition X on September 1, 2020 and Person B started the same trial for the very same condition on April 1, 2021, we fundamentally cannot compare Person A and Person B today, as Person A has had significantly longer exposure to the drug. However, we can compare each of their reactions and behaviors in the first 30 days of the trial.
Cohort analysis can be used for various populations — everything from people to pipeline opportunities — and can be cut across myriad time dimensions (weeks, months, quarters, etc.).
From pharmaceutical trials to SaaS pipeline math
In the example below, we look at the number of qualified sales opportunities created in each quarter and what portion of those opportunities close in the same quarter, +1 quarter, +2 quarters, etc.

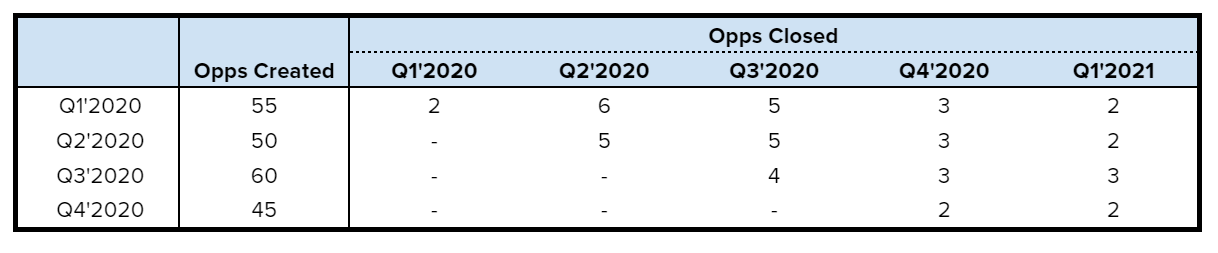
Example: Sales team created 55 qualified opportunities in Q1’2020. Of those 55 opportunities, 2 closed in that very same quarter. Of those 55 opportunities, an additional 6 opportunities closed one quarter later (Q2’2020). Of those same 55 opportunities, another 5 closed two quarters later (Q3’2020).
As more quarters pass, we can begin to build an average in-quarter win rate, a +1 quarter win rate, and so forth. In-quarter win rate is calculated as follows:
- Q1’2020: 2/55 opportunities close in-quarter = 3.64%
- Q2’2020: 5/50 opportunities close in-quarter = 10.0%
- Q3’2020: 4/60 opportunities close in-quarter = 6.67%
- Q4’2020: 2/45 opportunities close in-quarter = 4.44%
- Average in-quarter win rate = 6.19% or (2+5+4+2)/(55+50+60+45)
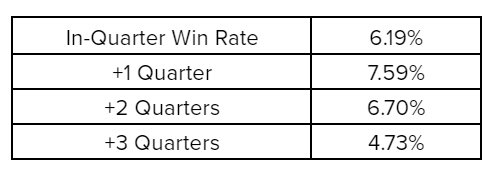
The same math applies for +1 quarter, +2 quarters, and so forth, ultimately yielding the following cohort-level win rates:

While the aforementioned example considered cohort behavior by opportunity count, it is equally (if not more) helpful to examine cohort behavior by dollars piped.

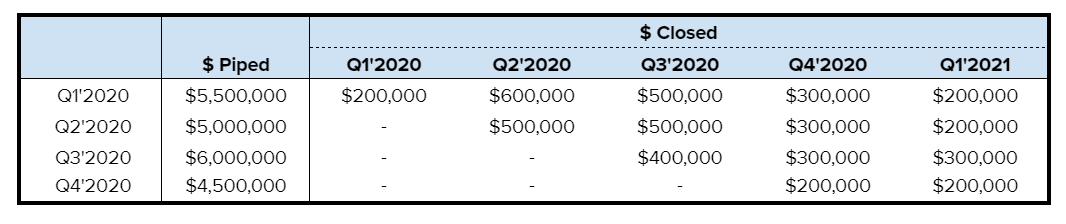
When we run the very same in-quarter, +1 quarter, etc. calculations for the dollars closed view (vs. the count of opps view), the win rate “intake” not-so-coincidentally lands us in the very same place:
Leveraging cohort behavior to forecast bookings
Now that we understand what our closing dynamics look like over time, we can leverage our win rate intake curve to produce a booking forecast.
Let’s assume that we’re nearing the end of this quarter (Q2’2021) and have built the following pipeline over the past year:
- Q2’21 — $6MM
- Q1’21 — $5MM
- Q4’20 — $4MM
- Q3’20 — $3MM
We can multiply these historical pipeline numbers by our win rate intake breakdown to forecast our Q2 bookings. Q2 forecast is the sum of:
- Q2’21: $6MM * 6.19% in-quarter win rate = $371K
- Q1’21: $5MM * 7.59% +1 quarter win rate = $379K
- Q4’20: $4MM * 6.70% +2 quarter win rate = $268K
- Q3’20: $3MM * 4.73% +3 quarter win rate = $142K
- Q2’21 expected bookings forecast = $1.16MM
Leveraging cohort behavior to identify pipeline gap analysis
Now let’s assume that we are at the start of Q3’21, and we need to unpack 1) our ability to hit a $2MM bookings target for the quarter and 2) what it will take pipeline-wise to get us there (since we’re at the start of the quarter, let’s assume we’ve generated $0 pipeline for Q3 thus far).
Our Q3 bookings forecast based on the historical pipeline and our win rate intake is the sum of:
- Q2’21: $6MM * 7.59% +1 quarter win rate = $455K
- Q1’21: $5MM * 6.70% +2 quarter win rate = $335K
- Q4’20: $4MM * 4.73% +3 quarter win rate = $189K
- Q3’21 start-of-quarter bookings forecast = $979K
Knowing our Q3 bookings target is $2MM and that we can count on $979K to close from our previously generated pipeline, we recognize that we have a $1.02MM bookings gap we need to close to hit our plan.
To find an additional $1.02MM in bookings for the quarter, we can use our in-quarter win rate (6.19%) to calculate the amount of new pipeline required to find the $1.02MM. In other words, we need to generate $1.02MM ÷ 6.19% ($16.5MM) of the new pipeline this quarter.
While nothing is impossible, $16.5MM of the in-quarter pipeline is quite a stretch from the $6MM generated the prior quarter, so we will likely need to either forecast our plan or get very aggressive and creative about our top-of-funnel activities for Q3!
The aforementioned examples are deliberately high-level in an attempt to convey a general construct for using cohort analysis for pipeline and bookings math, but companies can absolutely layer on added complexity — by month, by customer segment — as they grow and scale.