Pivot to Profitable: Smart Changes You Can Make Today
With top-line growth and net retention rates compressing, companies must think about their paths to profitability wildly earlier than ever before. Here are eight concrete tactics to help you grow your margins in pursuit of the holy grail of profitability.

In last month’s installment of Tactic Talk we discussed how to move the needle on net dollar retention rate. But with recent data suggesting that SaaS companies are experiencing compression in both net dollar retention and year-over-year ARR growth, companies must focus on efficiency and profitability metrics wildly earlier than ever before, so the topic of margin optimization has become ubiquitous in board meetings.
Companies can influence their margin profile by increasing their top-line revenue (e.g. raising prices) or optimizing their cost basis (e.g. lowering support team costs by investing in offshore teams); our examples will mostly focus on the latter.
Here are eight concrete tactics to help you grow your margins in pursuit of the holy grail of profitability:
1. Challenge the economics of your service model
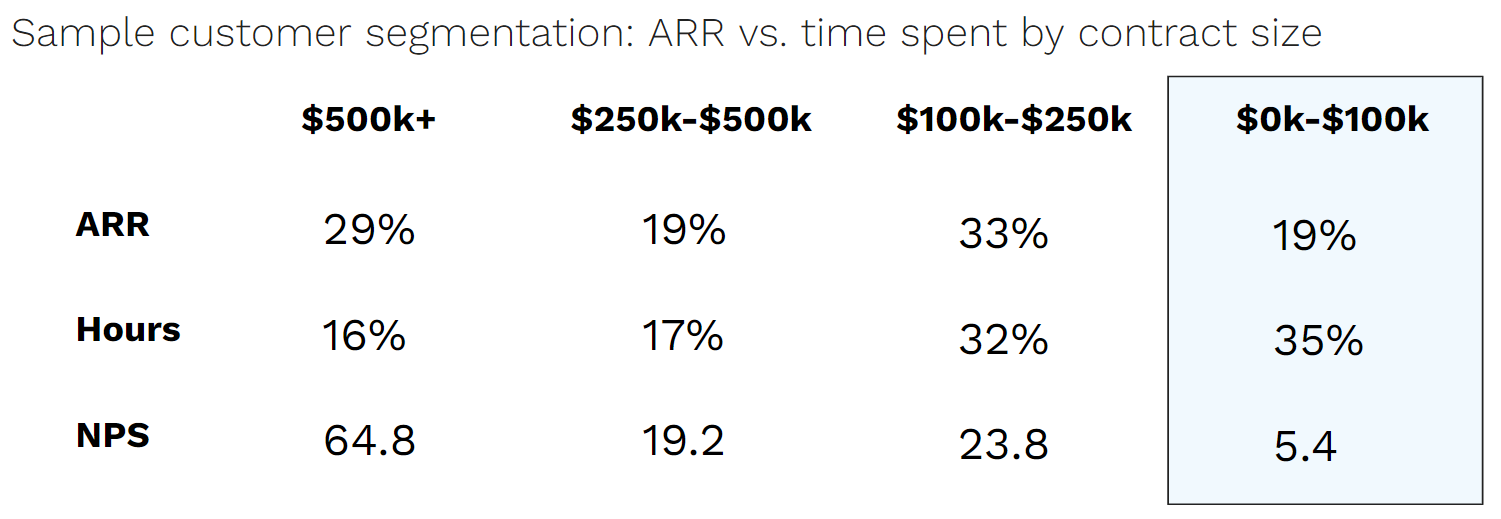
The chart below details attributes of different customer segments by ACV band: in the left-most column, we learn that customers paying $500K+ per year comprise 29% of Company X’s total ARR, consume 16% of total CSM team hours (technical support hours are excluded in this example), and boast a net promoter score (“NPS”) of 64.8. (To calculate “hours,” Company X instrumented lightweight time-tracking for CSMs: they spend 10 minutes at the end of each day tagging their activities to different topical areas and specific customers.)
The “shot heard ‘round the world” in this chart is the right-most column: customers paying <$100K per year comprise only 19% of total ARR, but consume 35% of the CSM team’s waking hours. And to add insult to injury, their NPS is significantly lower!
In the face of data like the <$100K segment, Company X must challenge themselves on their service model economics. Why is this segment more time-intensive and less satisfied? Perhaps Company X’s product is resource-intensive and <$100K ACVs suggest small, under-resourced teams? This flavor of data could suggest an opportunity to “fire” customers who are wildly unprofitable to the business. I lived this exact scenario in a past life. We used the data to ask for the Board’s blessing to tell these resource-draining customers we could no longer provide access to a CSM without them paying for that access; if customers did not want to pay for that service, they would be limited to using the support desk only. And given our change in direction, we gave them the option to exit their contract at any time. Much to my surprise and delight, churn was significantly lower than we expected, and many customers were actually willing to pay an annual fee to maintain access to a CSM.
2. Ensure every FTE is focused on their highest value work
Using the same time-tracking methodology outlined in the prior example, Company X assesses the type of work being performed by CSMs, only to learn that 35% of hours are being spent on ticket support. This is a financial crime! That statement might sound hyperbolic, but it’s true: support agents typically cost 25%+ less than CSMs, so if CSMs are performing support work, it is absolutely not the highest-value use of their time.
This precise example–CSMs doing support work–is not at all uncommon. Very often companies focus on scaling the CSM organization before the support organization, resulting in understaffed support teams and CSMs feeling as though they must “chase” ticket resolution to maintain customer satisfaction. This is a poor experience for everyone–the CSM, the support agent, and the customer–and is easily resolved by investing in the right people for each task.
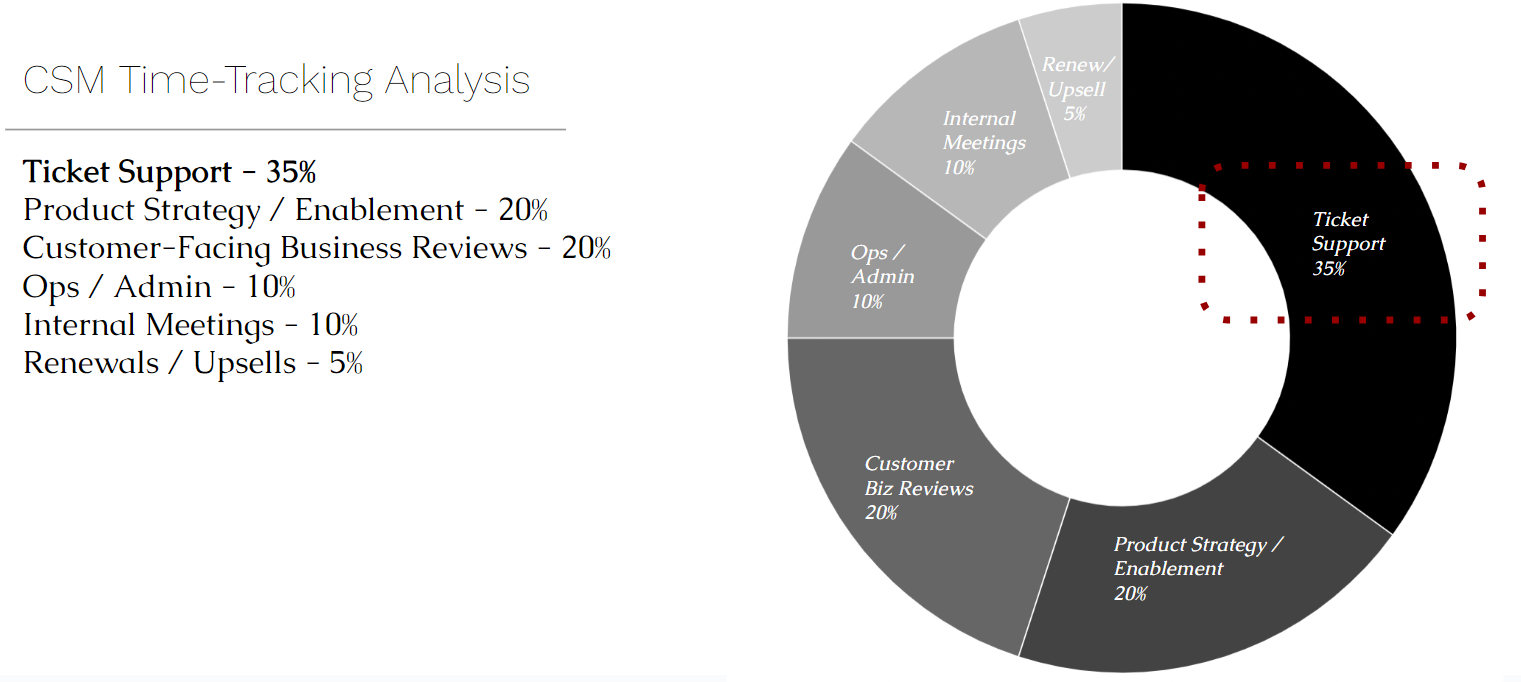
There are myriad other ways to interpret the sample data beyond the ticket support example. If 10% of CSM time is spent on operations or administrative matters, how much of that time could be recouped with a dedicated CS ops hire? When I was the CCO at Sailthru, I resisted investing in CS operations for longer than I’m proud to admit. But one day, our VP Customer Success Ellen Terchila (now CCO at Hootsuite) said to me, “if you fund a dedicated CS ops hire, I guarantee you I can increase ARR per CSM by at least 15%”–music to my ears, and she delivered! This is how great CS leaders must think: what investments or changes can be made to get more leverage from your CSMs (or really, any team)?
3. Consider investments to make your team more efficient
Let’s further pull on that last thread. The phrase “do more with less” has become quite the cliche in the SaaS world over the past few years; the central idea is that you identify ways to create more leverage for each employee.
There are three common avenues for enabling employees to do more with less:
- Staffing. The aforementioned CS ops example is a relevant one, as it unlocked more productivity per CSM. Make sure the right people are focused on the right work so that each employee is producing the highest-possible value per hour.
- Automation. Seek to understand what efficiencies can be gained through automation (or better yet, what busy work could potentially be eliminated altogether). I recently sat in a Board meeting where the CFO revealed that when their finance team learned that each CSM was spending literally hours on raw data pulls for every single customer business review, the finance team was able to build macros that literally stripped more than 10,000 hours of manual work out of the business that year 🤯
- Software. Are there technology investments (and more specifically given it’s 2024, AI investments) the business can make to allow employees to move faster and do more? For instance, Primary’s portfolio company Lantern is using AI to help CS teams better understand both prospect signals and customer risks in a swifter and more automated manner.
4. COGS or S&M? Use data!
Time to harp on the importance of time-tracking for one more example. Oftentimes SaaS companies debate whether CSM headcount should be classified as Cost of Goods Sold (“COGS”) or Sales and Marketing expense. Use the data to make this decision!
In my past life as an operator, we deliberately designed the time-tracking topic tags for CSM work such that they would be immediately usable to the Finance team for expense classification purposes:
- Was this work customer-facing or internal? If customer-facing, which customer? This level of depth ultimately helped us with customer-level profitability assessments.
- Was this a standard check-in call with the customer or did it involve a renewal or cross-sell conversation? (Put another way, was this about servicing the customer or retaining/growing the customer?)
The end result of this time-tracking yielded a decision to classify individual contributor CSMs as 75% COGS / 25% S&M but to classify the managers of the CSM team as 75% S&M / 25% COGS, as they were most often being pulled into customer conversations for contractual matters.
(Editor’s Note: this is yet another reason to avoid having CSMs doing support work, as that work sits squarely in COGS. Your CSMs represent a higher cost basis than support agents, so this misallocation of resourcing will very negatively impact gross margin.)
5. Explore geographical diversity to optimize your cost basis
People costs are the #1 drive of burn, so reducing the absolute cost basis of your employee base is one of the most straightforward ways to boost margin. When companies can’t reduce headcount through other efficiency gains, they invariably must think about other ways to bring down payroll expenses. It is significantly more cost effective to build a team in Nashville than it is in NoMad, so it is not uncommon for companies to invest in satellite offices (or to just build in a distributed manner–we’ll save the debate on in-person vs. distributed for another day!). Recent Pave data suggests that a “mid-level” support hire costs 23% more in a Tier 1 city than it would in a Tier 3 city. For customer success hires, that rate is 26% higher.
Pave Data: 50th Percentile Base Salary Benchmark for “Mid-Level” Support

Pave Data: 50th Percentile Base Salary Benchmark for “Mid-Level” Customer Success

And while the difference between Tier 1 and Tier 3 cities in the U.S. is certainly notable, the difference between the U.S. and off shore resources is even more material, so an increasing number of SaaS companies are standing up operations overseas.
6. Mind the gap when it comes to non-billable PS work
At the onset of this installment I said that this list would be “mostly” focused on how to optimize your cost basis; this tactic is the exception! The Professional Services (“PS”) function offers fertile ground for improving overall business margins, largely because much of that work is often not funded by customers; the simple act of monetizing more of that work goes a long way.
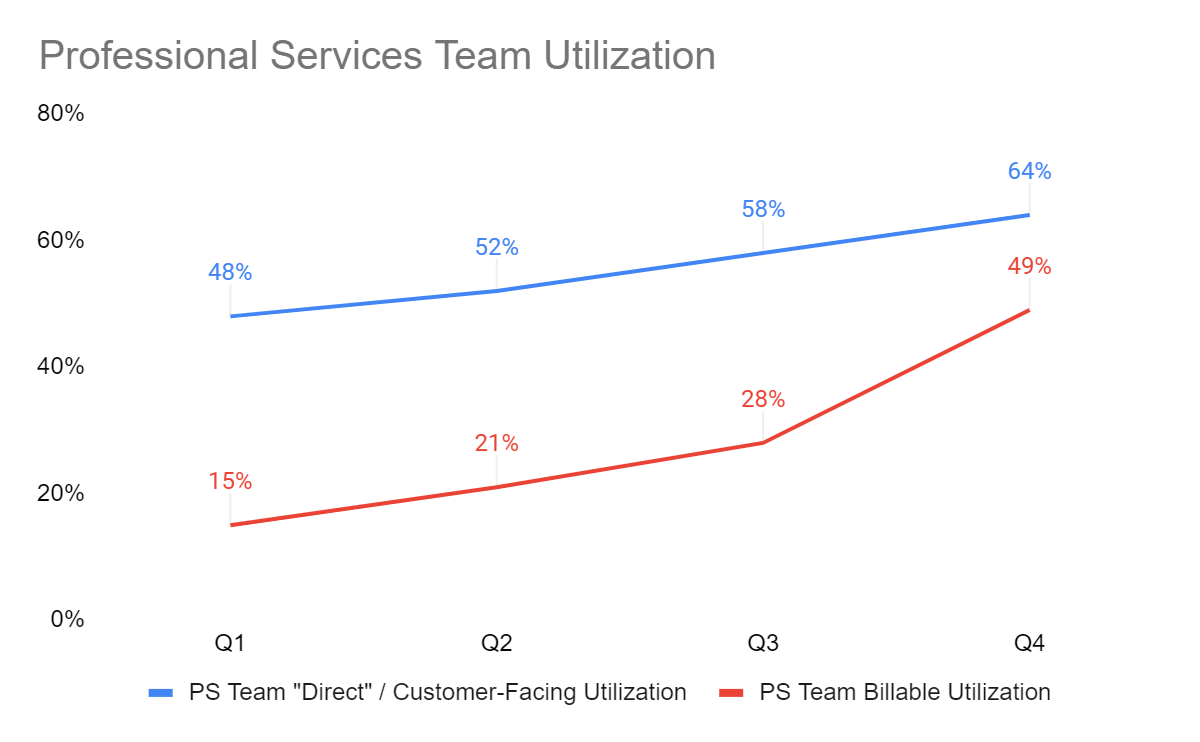
SaaS companies never want to over-index on services revenue, but it is important to cover services expenses (both for new customer implementations and for ongoing ad hoc customer needs). It is even more important for PS teams to track time than it is for CSM teams. With tracking in place, SaaS companies can compare overall customer-facing hours (red line below) with billable customer-facing hours (blue line below), and they’ll often find a striking delta between the two. In this particular example, Company X did a nice job closing the gap between the lines in Q4 (read: they charged customers for more PS work), though I’d argue they are still spending too many hours on non-customer facing work!
(Editor’s note: the topic of PS monetization is a big enough one to warrant its own installment of Tactic Talk, so look forward to that later this year!)
7. Leverage support ticket data to inform your product roadmap
When it comes to margin optimization ideas, Idoplay favorites, and the practice of leveraging support ticket data to inform roadmap decisions is my #1 favorite play.
The chart below summarizes the number of “touches” (back-and-forths) required to resolve tickets in different topical areas. For example, tickets related to GDPR require an average of 5.7 touches to resolve.
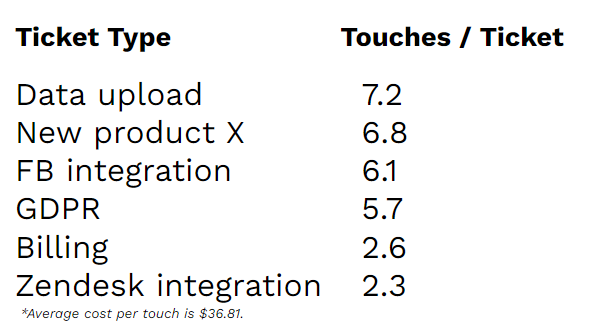
Touches Required per Ticket by Topic Area
The footnote of this chart also denotes an average cost per touch of $36.81; to calculate that figure, Company X calculated the fully-loaded annual cost of its support team and divided that figure by annual “touch” volume across all tickets.
With information on both cost per touch and average number of touches per ticket type (say that five times fast!), Company X can calculate a total cost for each ticket topic.
The first chart revealed that GDPR tickets took an average of 5.7 touches to resolve. At $36.81 per touch, that means the average GDPR ticket costs $210 to resolve (illustrated by cost/ticket below). With 1,592 GDPR tickets in the last twelve months (“LTM” volume), Company X calculates that GDPR tickets cost them a whopping $334,029 last year!
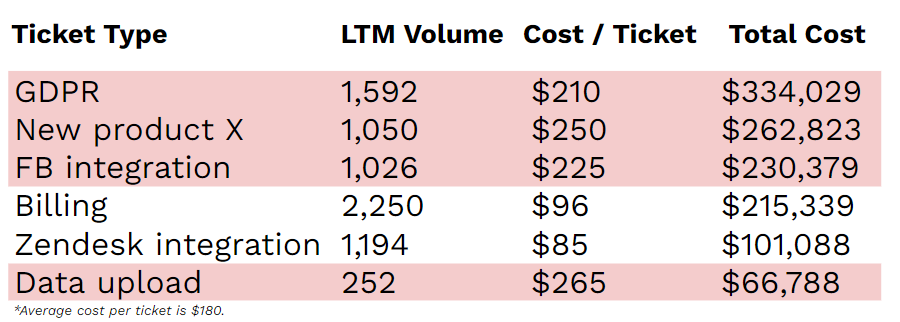
Where does the product roadmap come into play? Perhaps the GDPR tickets pertain to Company X having to do manual user data deletions when requested. Is there a simple tool the product organization could scope that would allow customers to self-service those deletions and strip costs out of that topical area? Probably.
(The footnote of the second chart also indicates Company X’s average cost per ticket, which provides an easy benchmark for the costliness of each topical area.)
8. Deploy good old fashioned ticket deflection techniques
Leveraging support data to inform product investments is the ultimate form of ticket deflection, but it’s not the only path. In the absence of strong partnership with Product, CS, and support teams can invest in tried and true techniques such as knowledge base articles, how-to videos and even chatbots. (Hint: use the ticket data to prioritize which content to produce first!)
—-
This hit list of tactics is by no means exhaustive, but hopefully sparks some ideas for ways to boost organizational efficiency in the very near term.
